HR Analytics Dashboard in Tableau
This interactive dashboard offers a comprehensive view of key HR metrics and insights, empowering organizational decision-making.
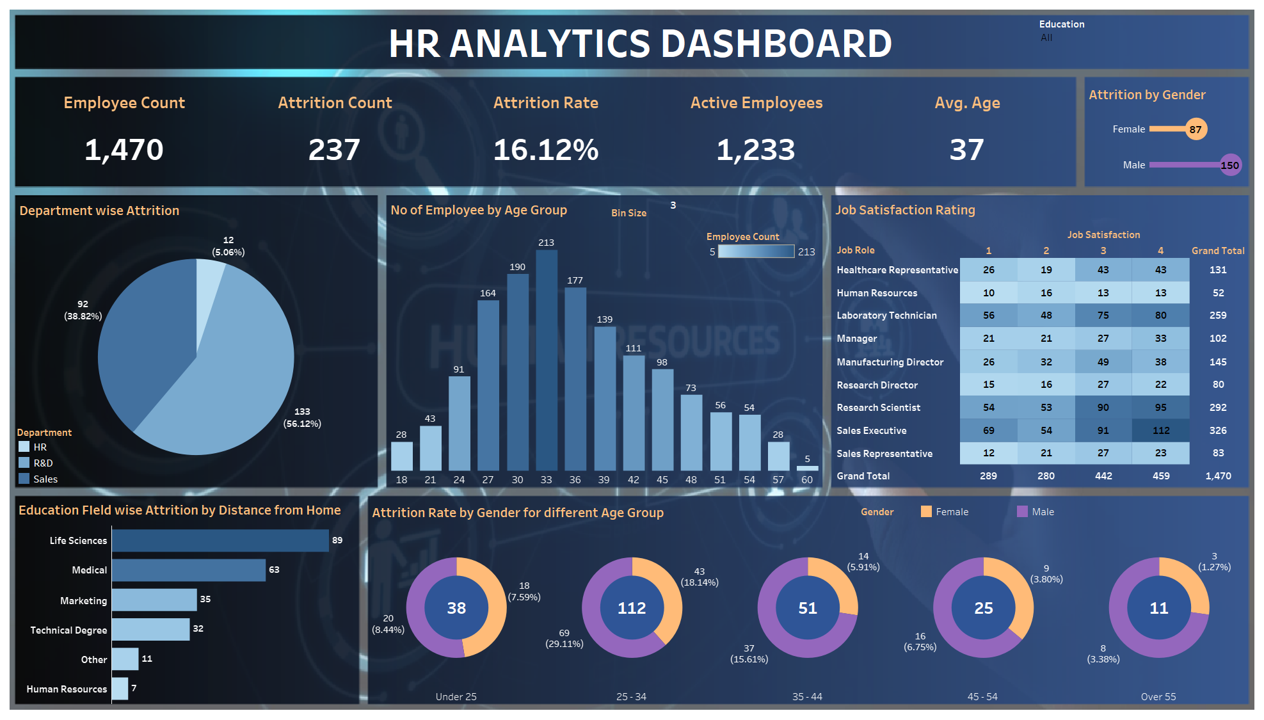
Data at your fingertips:
Dive into employee data encompassing departments, demographics, job satisfaction, and more.
Track trends and patterns with visually compelling charts and graphs.
Identify strengths and areas for improvement based on data-driven analysis.
User-friendly navigation:
Explore data with ease through intuitive filters and interactive elements.
Drill down into specific details by department, job role, or other relevant criteria.
Export data reports for further analysis and sharing.
Designed for clarity:
Modern and engaging visual design fosters data comprehension and exploration.
Clear and concise visualizations communicate complex information effectively.
Customizable layout enhances user experience and facilitates personalized insights.
Benefits across the organization:
HR professionals gain deeper understanding of workforce dynamics and trends.
Management teams make informed decisions based on data-driven insights. Employees engage with a transparent and accessible data platform.
This dashboard serves as a valuable tool for anyone seeking to leverage HR data for strategic advantage.
For more technical details about my project, feel free to check out my Github repository and LinkedIn Profile.
Your feedback matters a lot!