Netflix Trends Dashboard in Tableau
This interactive dashboard explores fascinating trends within the vast Netflix catalogue, empowering viewers and analysts to delve deeper into the content library.
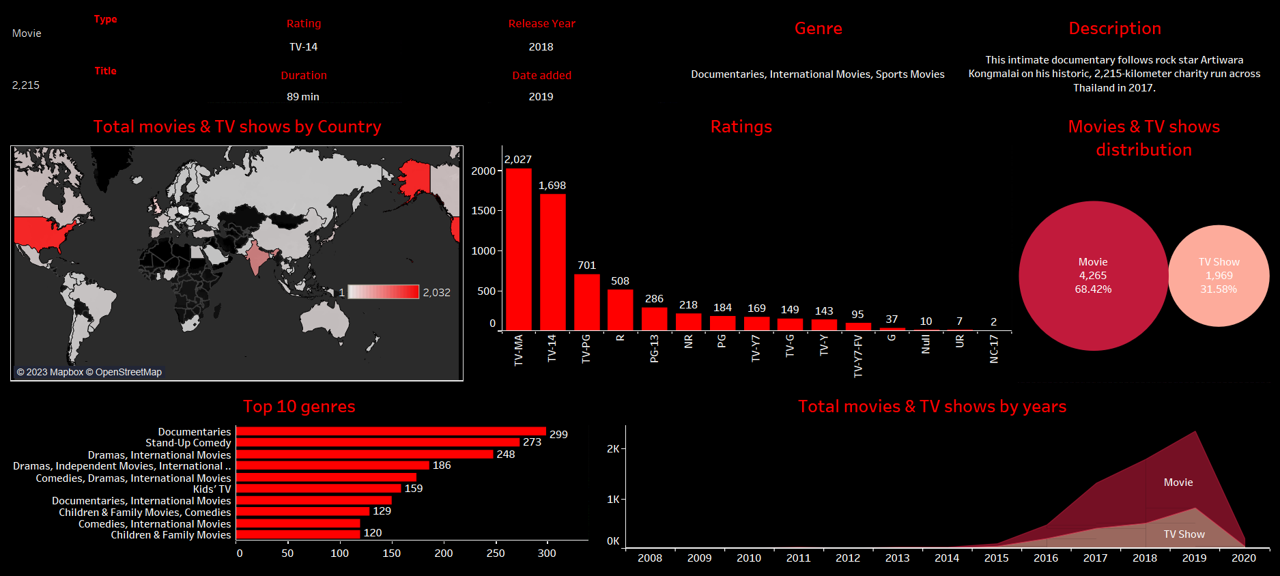
Key insights at your fingertips:
Global popularity:
Discover which countries devour specific genres, pinpoint trending titles, and track the evolution of content preferences across diverse regions.
Genre analysis:
Uncover the most popular genres by country, release year, and rating. Identify rising stars and hidden gems based on user engagement.
Release year insights:
Track the evolution of content over time. See how release year influences genre popularity, ratings, and viewership patterns.
Rating breakdown:
Analyze the distribution of ratings across different genres and countries. Identify the most critically acclaimed and user-beloved titles.
User-friendly features:
Interactive filters:
Narrow down your exploration by country, genre, release year, and rating with intuitive filters.
Comparative visualizations:
Compare trends across multiple variables on a single screen, revealing intricate relationships and patterns.
Data is presented in visually appealing and easy-to-understand formats, making insights accessible to everyone.
This dashboard serves as a valuable tool for:
Netflix enthusiasts seeking personalized recommendations and hidden gems. Content creators and analysts identifying audience preferences and emerging trends. Anyone curious about the world of streaming and its ever-evolving landscape. Dive into the data and discover the untold stories within Netflix!
For more technical details about my project, feel free to check out my Github repository and LinkedIn Profile.
Your feedback matters a lot!